Home

Oligo sensor

Leave a comment

A lifelong ambition of mine has always been to be part of a team of people who race past the conventional boundaries and are surprised by every new possibility.  Where being creative was a habit that you couldn’t turn off and no terrain of thought was forbidding.

There is a cozy little shop in Spokane, Washington that smells of photoresist, solder and machining coolant oil where that happens every day.

NLIWhen I was there from 2001 through 2003 we had just enough contractual work to  produce just enough surplus energy to get the next contract.  But the culture there placed such a high value on creative and innovative approaches that it was the funnest place I’ve ever worked at.

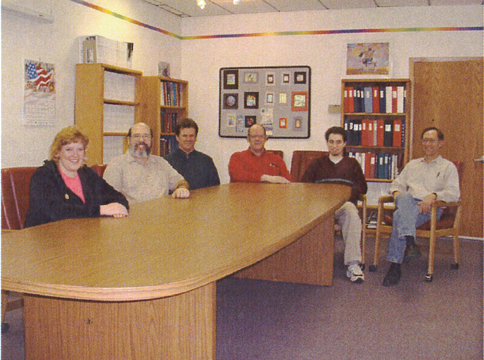
The principal (seated on the right) is the president of the company who holds several patents including several very successful patents in holography.

One of the ideas he tried to patent was an electronic sensor of oligonucleotides based on two facts: The different weight of the base pairs in a single strand of DNA and the fact that there exists a resonant frequency for any oscillating body.

My work involved preparing gold plated test slides for attaching the 5′ end of oligonucleotides of known composition.  When a complimentary nucleotide bonded with this, it could be attached to the sensor and then separated by heating and tested for its composition.

Each sensor cell consisted of a gold foil diaphragm that would be set to oscillating by a frequency generator with reflected light measuring the degree of deformation of the diaphragm.  The frequency that took the least energy to maintain would be the resonant frequency of that cell of the sensor.

Adding weight to the cell would change that frequency.

Unfortunately someone else was awarded this patent first and the proof of concept development stopped.

Strange that.  Why is it that every time I join efforts with really creative people, I end up building the ACME widget that ends up with Wiley Coyote at the bottom of a grand canyon?

Advertisement

Deconstruction: Cauchy time with the sink

Leave a comment

In economics there’s something called the Edgeworth box which attempts to illustrate how two people with different production possibilities might trade with each other.

I’ve always maintained that a similar construct could be used to illustrate how two people with slightly different idea/word-meaning values might communicate (i.e. trade and barter meanings).

This theory neatly explains how spectacularly I fail to communicate with programmers.  It’s because I completely lack any meanings or ideas that they want to trade in.

In the game industry of Seattle, everyone integrates easily with the same geek-chic humor we’ve had since the early 1990’s but programmers quickly separate themselves from the non-linear thinking of non-programmers.  When they saw us data wonks floundering because our managers keep asking for different slices of the data, 5 programmers slammed the same sticky note to the Scrum board: Automate finding patterns in the data.  At that point, I had nothing of value to add to the conversation.

My abstractions about player values and the equilibrium of the game’s economy solicited the same sympathetic disdain they show artists debating the color schemes of a game.  They quickly disappear into the safety of their code.  (Meanwhile the concept artists are drawing ridiculously chibi-headed caricatures of the programmers as zombie fodder for their next project.)

The product they came up with is what is hailed as the newly minted discipline of Data Science.  The application of apps to data from apps to build better apps from.

But instead of actually improving the outcomes it simply puts the mantra of “fail cheaply and fail often” on steroids.  Although you can’t derive any moments from data that comes from a Cauchy-generating process, you can subject it to a power series that will quickly reveal…you guessed it, something to find patterns in.

One of the places I saw this clearly was in the balance of soft and hard currencies in a builder game we were designing.

In the early 2000’s everybody was enamored with agent model simulations that could simulate the data you’d get with agents that a finite set of rule-based behaviors.  I don’t know why we thought this was so special.  Game designers have been using simulations on board games forever.

For games that monetized based on currency shortages, however, you had to build separate simulators for currencies so that you wouldn’t accidentally nerf or buff a virtual good that you just spent the last 5 levels increasing the value of.  In mid-2012 Joris Dormans created an online simulator called Machinations to do just that.  You constructed sources and sinks of each currency and a few other logical conditions to build an animation of the flows along with a graphic that simulated what you would see from an instrumented game in Beta.  Now with a model of the mechanics, a par sheet of probabilities and well constructed on-boarding I should be able to balance the economy right?  Well…except for those pesky players who refused to play as scripted.

No matter how well we balanced the economy in the builder game, results came back from tests in Canada that players were not making choices that could be classed as strategies or player-types.

When our programmer got hold of Joris’ open source program, he immediately bolted it to a genetic algorithm to maximize the flow of resources (including In App Purchases). This would seem the right thing to do as a programmer but it ignores the fact that entrepreneurs and gamers live by:  One plays to beat expected values, not to meet them.

Once again, the charts produced by Machinations that most closely matched actual data were those with the fattest tails of a distribution (Cauchy).

No matter how many ways the problem was ‘diagnosed’ player retention dropped (with a freemium ‘Thud!’) right at the point the player met a paywall.

Now it was time to bring out the big guns of behavior analysis…psychology.

Deconstruction: Apophenia. Goddess to Feather Merchants

Leave a comment

The absolute genius of game designers is that they understand economics at a very sophisticated and subtle level.  What they do to manipulate people’s learned value of engagement is only now being appreciated by educators, social scientists and economists as a real tool.

This is what truly excited me about the possibilities of this industry.  How did these geniuses build up a sense of value in a virtual good such that people would willingly spend millions of dollars to possess?  and then brag about it?  The artificial creation of value is what lies at the heart of economic growth and collapse and these guys had mastered it into an art.  Literally, an art.

That’s when I met the marketing department.

For us managers, marketers and feather merchants, artistry is just another asset to be exploited.  Our main ‘sploit’ seems to be to convince the game designers that we have hidden knowledge of the players that they do not.  We do this by leveraging apophenia.

Apophenia is the tendency of humans to see patterns in random.  It is not just a comfortable delusion…It’s a savanna-bred imperative for survival and tops the agenda of most business meetings.

In the case of the game industry it works like this: Take any given population of players and say they’re all motivated to act differently.  Let’s say we actually graph their likelihood to spend money on something over time and find that the curves those ‘likelihoods’ trace includes every shape from a ski slope to a bell curve to a wall.  The deeper we go, the more random we find people’s preferences, motivations and willingness to spend money are any given point in time.

Now take a game in the Apple or Google store and solicit random downloads from among this population and graph the likelihood they’ll spend on level 7 of your game.  You’ll get a bell curve…but a bell curve with really fat tails.


You can convolve a random selection from a set of random distributions (with varying σ), but you’re no longer able to derive their moments (mean, standard deviation etc.).  Instead the best description of their central tendency is by what astronomer’s use to describe the brightness of stars that appear fuzzy around the edges: Full width, half maximum (FWHM).

The next day you’ll get a different random selection of distributions (even from the same players) but everyone staring at the chart will clearly see a middle and call it average.  Stats classes do us a severe dis-service by stating everything in terms of normal distributions because forevermore, we’ll use the mean of a normal distribution (think “bell curve”)  for the expected value and central tendency of any set of measurements.

So what happens when we design changes in the economy of a games points/currencies and power based on a mistaken distribution of player behavior?  BAM!  SPLAT! Game over!

When the product owners completely change of direction in the game at every scrum retrospective (with the predictability of a Roomba) you can be pretty sure you’re not measuring expected values. But the apophenia persists and we’re sure we’d have a hit, if we could only expose it!

When the first dozen diagnostics don’t change outcomes, managers double down on their ability to see patterns in the data and recursively make the situation worse.  They’ll ask their data analysts for increasingly obscure cross tabulations to feed an endless cycle of “AHA!  I knew it!…wait, that doesn’t work?!  Gimme….” moments.

So what happens to insight analysts in this environment?  How do they maintain their worth in the face of a habit of failed recommendations?

Here is where I met the fourth leg of the video game industry…the programmers.